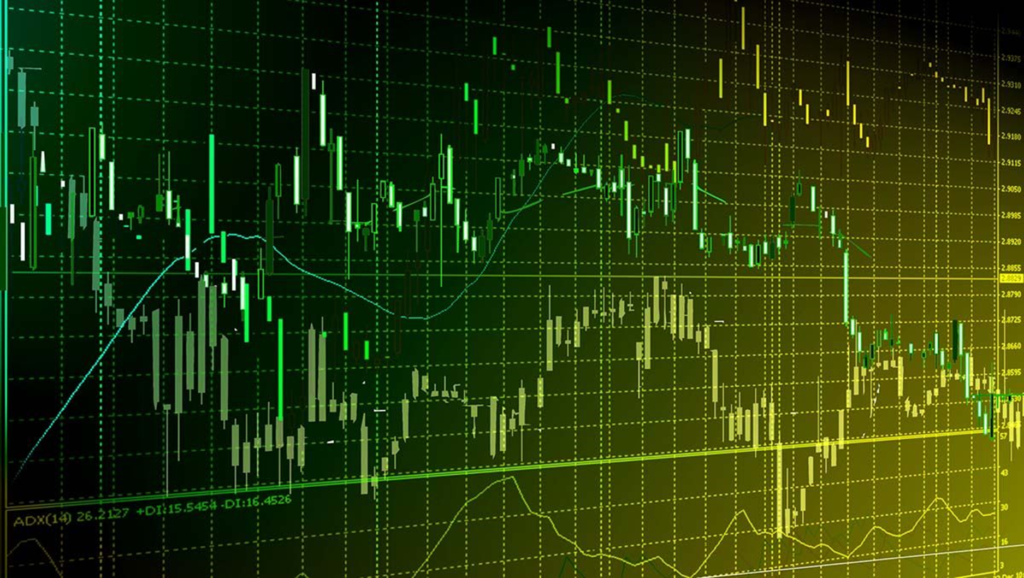
Indicators for trading are actually mathematical calculations that give rise to price charts and that help to identify trends and signals within the market itself. There are many indicators that express different data that at first can be somewhat confusing. Two main types of indicators can be differentiated: leading indicators and lagging indicators.
Leading indicators are those that predict future behaviour and price predictions. In contrast, lagging indicators are those that analyse and take into account past trends. They are both a huge source of information for traders, and their knowledge is absolutely essential in order to trade.
Main indicators for trading that you must master
We are going to review the most important indicators, it is not a list in order of importance, but they are the main ones to use according to one or another strategy.
Moving Average (MA)
It is an indicator for trading that is used to identify the direction of the price trend at that moment. The interference of peaks in short-term prices is not considered, it consists of that current moment. The value is obtained by combining the prices during a certain period divided by the amount of data. In this way, a line will be obtained that will show the trend.
Based on the length of the moving average, the data used will be determined and as a result, resistance and support levels can be obtained. Thus, by looking at the previous price action, it will be possible to extract future patterns that may occur.
Exponential Moving Average (EMA)
This is another way of expressing a moving average, in this case it gives more importance to the most recent data points. Thus, it makes the data better fit the new information that is being produced. By combining EMA with other trading indicators, information for investors can help confirm significant movements and their legitimacy.
The most common are the 12- and 26-day EMAs for the short term and the 50-200 for longer-term trend indicators.
Stochastic oscillator
It is a trading indicator that what it does is compare the specific closing prices of the assets with a range of their prices during a period of time. In this way, it gives information on the trend and the momentum it may have, expressed in values from 0 to 100.
For values below 20 it implies that it is an oversold market, on the other hand, above 80 it would be an overbought market.
Average Convergence / Divergence (MACD)
It is a trading indicator that detects momentum changes when comparing two moving averages. It is very useful to identify buy and sell opportunities based on resistance and support levels. The concept of convergence means that these two moving averages are moving closer together (momentum decreasing), on the contrary, divergence is that they are moving away from each other (momentum increasing).
Bollinger Bands
Indicator that expresses a range in which the price of an asset must be trading. The increase or decrease in bandwidth will reflect recent volatility. In this way, if the bands are narrow and close, there will be less volatility of the financial instrument. On the other hand, if the bands are wider, it means that the volatility is greater.
These trading indicators are very useful to know when an asset is being traded and are used to predict longer-term price movements. If a price is continuously moving outside the upper values of the band, it could be overbought. Conversely, if it were to move under, it could be oversold.
Relative Strength Index (RSI)
It is an index that is used mainly as a signal that warns of dangerous movements in prices, as well as to identify impulses in the markets. It is a value between 0 and 100, so that when it approaches 70 it is associated with overbought and if it is around 30, it is considered as oversold.
Fibonacci retracements
Fibonacci Trading Indicators show the degree to which the markets will moveagainst how they are behaving at the time. For example, a setback will occur when the market falls temporarily, which is called a pullbackor deceleration.
Trading experts agree that a market that is about to move often uses this indicator to confirm it. Thus, they provide information about where to apply limits and stops, or when to open and close positions.
Other indicators for trading
In addition to those already mentioned, there are many other indicators to consider such as “Standard deviation”, “Ichimoku Cloud” or “Directional Average Index” that complement the information in this article. We recommend that you go to an exhaustive and professional training to have these concepts well tied.
To do this, at TradEAsywe take care of providing quality training with expert teachers in the world of trading. Contact us and we will help you focus your career as a future trader, in addition, we will put at your disposal plans to operate with all the guarantees.